S.M.A.R.T. Target Setting Guide

YOU ARE VIEWING DATA GUIDE #3 OF 5
This Target Setting Guide is a companion for ASA Research’s Strategic Data Use workshops. The workshop content provides discussion regarding the importance of target setting and how to effectively set targets. Much of the workshop content is summarized here. This guide provides methodologies and tips to consider as you set your targets, along with a template that you can use to organize and document your targets. A case study describing models to estimate what is possible and tools to use while setting targets is also provided.
The ASA Target Setting Guide employs the SMART methodology for setting targets. SMART Target setting involves deliberate steps to know where you are now, what you are trying to achieve, and determining challenging but realistic amounts of improvement needed to get there. Be sure to allow the necessary time to discuss, conduct the research needed, and set good SMART targets. The target setting process takes time to complete.
Please contact us if you need assistance as you and your team set your targets, or would like to discuss convening a workshop.
Why is Target Setting So Important?
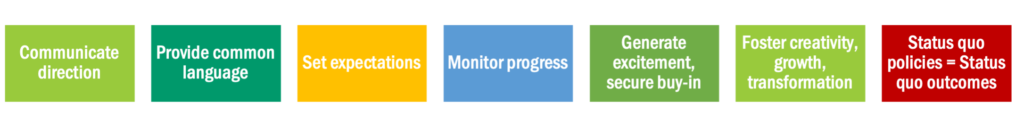
Target setting provides a concrete direction, a timeframe, and path to achieve your goals. Targets also provide a common language across staff and faculty, departments and teams. Working to achieve targets motivates us to effectively align resources, efficiently change the way we work, and challenge us to grow and transform. Just as in life, if you do not set goals or targets, things will maintain and remain status quo. Target setting helps to:
Good Targets Are…
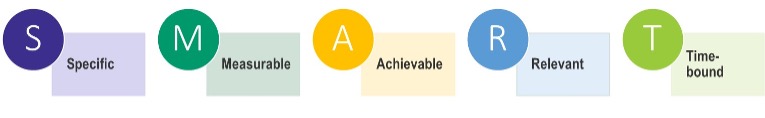
Setting a target is not about guessing what you can achieve. It involves deliberate steps to know where you are now, what you are trying to achieve, and determining challenging but realistic amounts of improvement needed to get there. Target setting can be tricky, and poor implementation can be demotivating and promote undesired behavior and suboptimized performance. The SMART model is widely used as a framework for target setting and can help to ensure you develop well-defined targets. The elements of SMART Targets follow.
- Specific. Precisely state what it is that you want to accomplish.
- Measurable. Targets need to be quantifiable so that you can monitor progress.
- Attainable. Do your research and ensure your target is realistic. Consider constraints such as financial factors, technology, culture, timing, and environment.
- Relevant. Make sure your target is relevant and aligned with your mission, students, strategy, etc.
- Timebound. Specify a timeframe to achieve your target.
The end goal of target setting is to have SMART Target Statements for all types of metrics – process and operational metrics, near-term metrics, and long-term metrics. The SMART Target Statement specifies who, what, how, how much, and by when:
The percentage of (who) (doing) will (increase/decrease) from (# or %) to (# or %) by (when) as measured by (which metric).
Click here to download a template of SMART Steps that will help to establish appropriate targets that are supportive of your student success work.
SMART Target Tips
Where Do We Begin?
Strategies and Metrics Maps visually show how your activities may affect near-term student outcomes, and how they link to long-term metrics, or the ultimate objectives you are trying to achieve. A Map illustrates “what” is to be achieved and the path to get there. A Map helps to understand the depth and breadth of activities, how activities influence student behavior, and can help to estimate the magnitude of effect your activities have on long-term KPIs.
Which Metrics?
Be sure to include near-term and operational/process targets along with long-term targets. If your long-term targets are not supported in the near-term, you will likely be unsuccessful. For example, you can’t expect to see increases in graduation rates without change in retention or credit accumulation, and do not expect student behavior and outcomes to change if activities are not implemented as expected.
Define and Agree on Where You Are Now.
It is important to carefully evaluate the historical data you are considering using as your target baseline. Was there a peak or valley in the historical data? If yes, why? For example, was there an unusual circumstance during that period, such as a recession, driving up enrollments and changing your students’ demographics? If yes, the data point may not be a good reference point. You may want to consider using data from a different period to inform your target setting.
Understand What is Possible, Manage Expectations, and Set Realistic Targets.
Using your historical data and benchmarks can inform what is possible. When benchmarking to other institutions’ data, understand the respective contexts and environments and how they differ from yours.
Mathematical models or “What If” scenarios using your institution’s student data can help to understand what is possible. Consider the example (see the Hypothetical U. Case Study for more details):
- 70% of students who complete gateway math in their first year return in the second; 30% of those who don’t complete math, return.
- An increase in the math completion rate from 10% to 12% will have minimal effect on retention.
- And increase in the math completion rate from 10% to 25% will be associated with a stronger effect on retention.
Allow enough time – it takes time for indicators, particularly long-term metrics, to show change, and the amount of change might not be consistent, year-over-year.
Project Forward.
Avoid status quo and groupthink, and “the way we’ve done things in the past” mindset. Set aspirational targets and consider that it may be about working differently, not simply working harder. This will help to surface creative solutions.
Be aware of what is to come. Take known future environmental changes into account such as a new/upcoming state policy or a known enrollment change. Consider the possible effects due to disruptions and derailments resulting from the COVID-19 pandemic or economic downturn. Assess your ability to influence, for example, what is your institution’s ability to change student engagement, advising policies, curriculum, pedagogy, etc.
Communicate.
Generate excitement and secure buy-in by including a variety of stakeholders in the target setting process. Studies show that broad participation in target setting leads to better performance because staff feel they have more control over the outcomes. People support what they create and will accept responsibility more easily.
Once targets are set, communicate the target(s) to all stakeholders. Post the written target visibly. Regularly communicate progress over time to keep everyone on the same page. Celebrate success to continue momentum and foster excitement.
Monitor and Adjust.
Targets are not rigid and should not be the bane of our existence. If it becomes evident that you will not be able to achieve your target, examine the reasons. Focus on what has been achieved, what has been learned about the process, and what are the key take-aways. Consider whether environmental or policy changes had a counter-effect on outcomes, or whether activities were not implemented as anticipated. Continual monitoring provides the opportunity to learn and adjust.
Good Targets Can Go Bad.
Setting targets does not guarantee success. To have impact, targets need to be properly set, monitored, and adjusted. Good targets turn bad when:
- Targets are not clearly communicated to stakeholders and those carrying out the work.
- Targets are carved in stone. Be sure to continually assess and adjust as needed.
- Achievements are not recognized. Celebrate success! It helps to keep momentum and motivation positive.
- Targets are not realistic. When setting targets, take the time to evidence that the target is achievable.
- Expecting too much, too soon. Be sure to assess the resources and capacities needed for the activities.
Case Study: Hypothetical U. Target Setting Process
Below is a summary of Hypothetical University’s target setting process. The summary includes illustrations of how the results of the Strategy and Metrics Mapping can inform a campus team’s target setting thinking and conversation (see ASA Research’s Strategy and Metrics Mapping Guide). The use of historical and other institutions’ data to benchmark are also described. Please note that for illustrative purposes, this is a rather simplistic model and your institution will likely consider more metrics and activities occurring simultaneously. The intention here is to provide ideas and example models.
Scenario
Hypothetical U. wants to support all students so that every student succeeds. However, Hypothetical U. has equity gaps in academic achievement and graduation rates between underserved and other students; there is a 10-percentage point equity gap in gateway math course success rates. Hypothetical U. is focusing on closing this equity gap with a two-pronged approach:
- Implement a new early alert system so faculty have real-time data about their students and can intervene quickly before it is too late.
- Faculty attend Diversity, Equity and Inclusion (DEI) training during the upcoming semester with the goal of reviewing their course content for inclusivity.
Hypothetical U. wants to estimate the magnitude of effect their activities will have on student behaviors and outcomes and will set targets.
Strategies and Metrics Map
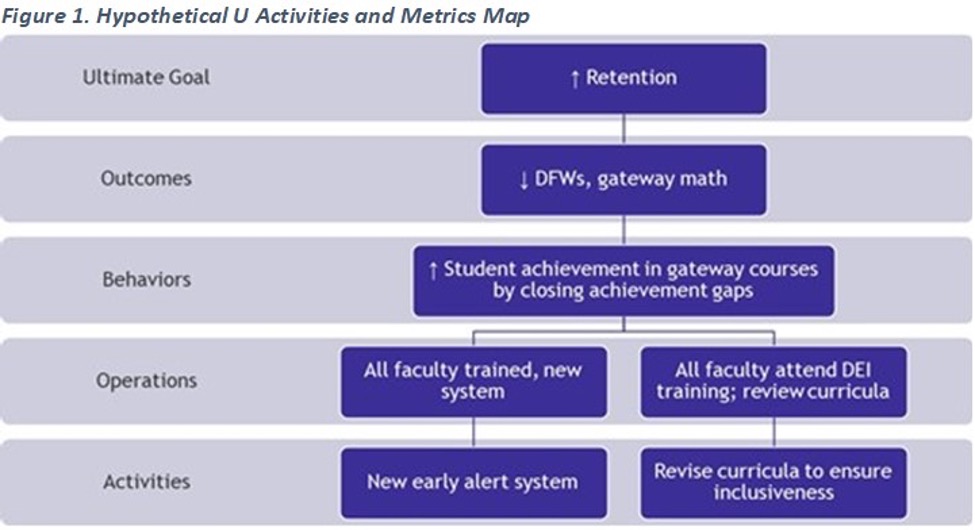
Hypothetical U. completed a Strategies and Activities Map. They began with process and operational metrics to assess the implementation fidelity of the early alert system, DEI training, and course content review (Figure 1), then selected near-term student outcomes metrics to assess the effects of their activities on gateway course completion. Given the changes to curriculum and knowing that success in gateway math is correlated to retention, by closing equity gaps in retention, they will increase the overall institutional retention rate – their ultimate goal.
Hypothetical U. Target Setting
The campus team began with setting targets for the process/operational metrics identified in their Strategies and Activities Map:
- All faculty will be trained on the new alert system by the beginning of the Fall 2020 semester.
- All math faculty will attend DEI training during the Fall 2020 semester.
- All math faculty will review/revise their course content by the end of the spring 2020 semester.
They then moved on to the near-term student outcome metrics. Fifty percent of Hypothetical U. enrollments are underserved students; the team anticipates that they will see the most improvement in gateway course achievement with this group given the focus of their activities, and expects slight improvement for other students. Hypothetical U. reviewed results from other institutions evidencing significant course outcome improvements when faculty have and act on real-time information about students, and for underserved students when course content is relatable for students from diverse backgrounds. From others’ experiences, Hypothetical U. is optimistic about its ability to influence significant gains in gateway completion, particularly for underserved students. Their near-term target statements follow.
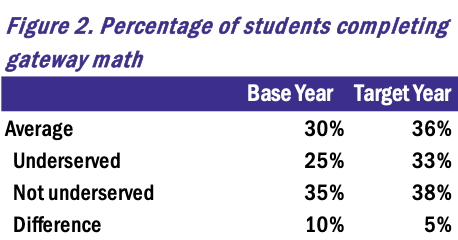
- The gap in the gateway math course success rate (achieving a C or better) between underserved and other students will decrease from 10 to 5 percentage points in the spring 2021 semester, with no decline in achievement by other students (Figure 2).
- Of all students attempting, the percentage of students successfully completing gateway math (achieving a C or better) will increase from 30 to 36 percent in the spring 2021 semester.
Examining historical data, and the relationship between gateway math completion rates across student populations, Hypothetical U. estimated the improvement in retention rates and set their long-term targets using the estimation model below (see Figure 3). This relatively simple model makes a number of assumptions – steady enrollments and composition of students, similar retention patterns over time, and a very limited number of influences on students and the environment – but provides campus teams with an example for determining “how much” is possible.
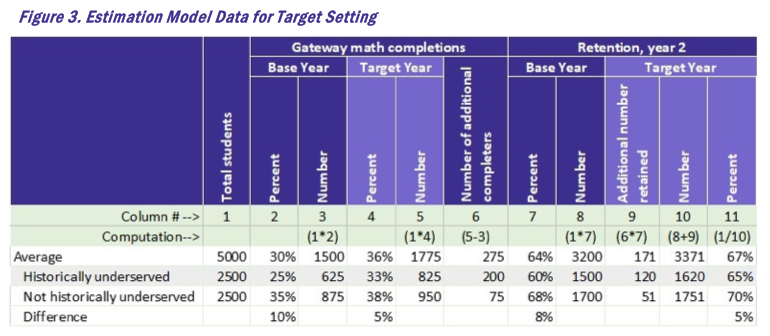
- Compute the number of additional students who will complete gateway math if the Spring 2021 target is hit. So, 25% of 2,500 historically underserved students completed gateway math in the base year, or 625 students.
- At a target of 33%, this increases to 825 students, for an additional 200 historically underserved students completing gateway math.
- Assuming a retention rate for the target that is similar to the base year—or 60% for historically underserved students—compute the number of additional students that will be retained: 60% of 200, or 120 students.
- Add the 120 additional students to the base of 1,500 retained students, for a total 1,620 historically underserved students retained.
- Compute the target percent, or 1,620 of 2,500 historically underserved students retained, or 65%.
Looking forward to evaluating the near-term metrics every term, Hypothetical U. decided it was prudent to begin evaluating their long-term target after completing one academic year of their new activities to provide sufficient time for students to attempt their gateway math course, and for faculty to revise curriculum. This resulted in Hypothetical U.’s formal target statements for the retention long-term metric:
- The percentage of first-time students retained will increase from 64 to 67 percent for the 2021 entering cohort, as measured by retention to their second academic year.
- The retention equity gap for first-time students will decrease by three percentage points for the 2021 entering cohort, as measured by retention to their second academic year.