Strategies and Metrics Map Model Guide

YOU ARE VIEWING DATA GUIDE #2 OF 5
This Guide introduces the Strategies and Metrics Map Model, a visual planning and organizing tool that supports and promotes methodological evidenced-based decision making throughout your student success work. Once completed, your map will clearly illustrate:
- How strategies and programs relate to – and how much they can “move” – student success/outcomes.
- How implementation and short-term outcomes link to long-term outcomes, or your ultimate objectives.
This Guide is a companion for ASA Research’s Strategic Data Use workshops. The workshop content provides discussion regarding the multifaceted uses of Strategies and Metrics Maps and provides the steps to create a map. This companion to the workshop provides discussion of the uses for the Strategies and Metrics Map Tool, methodologies and tips to consider as you develop your maps, and a template that you can use to organize and document work, along with an example case study.
Please contact us if you need assistance as you develop your map or would like to learn how to effectively integrate your map into other areas of your institution’s student success work.
Why Strategies and Metrics Maps?
Strategies and Activities Maps visually show how your activities may affect near-term student outcomes, and how they link to long-term metrics, or the ultimate objectives you are trying to achieve. A map is a communication tool that explains the “what” that is to be achieved, the intermediary steps to get there, and where each part of the organization contributes to achieving the ultimate target.
A well-designed Strategies and Activities Map is an organizing and planning tool that supports and provides a springboard for your student success work.
Understanding Linkages Between Activities and Outcomes
Maps…
- Illustrate how inputs and activities are related; that is, how your activities or projects are related to student outcomes, and changes in outcomes.
- Provide a vision for how much an activity may be able to move the needle.
- Illustrate how activities and resources—including intangible assets such as culture and employee knowledge—can be converted into tangible outcomes; for example, how faculty professional development may be related to student engagement, and thus retention and completion rates.
Communications Tool
Maps facilitate communication about goals, direction, and responsibilities, and help to organize data for storytelling. Maps…
- Communicate strategies and the rationale for activities across campus. For example, a map can illustrate the current state and the goal, or desired state.
- Communicate where everyone and each part of the organization contributes to achieving the ultimate goal, including lines of responsibility and authority.
- Provide reassurance. If plans are viewed as lofty or highly aspirational, the map illustrates concrete steps to reach the goal state.
- Provide an outline for your story. The map delineates your progression and shows the path taken to get to your desired change in student behavior at the end state. The map documents your activities along the way, the operations you implemented and – when coupled with a monitoring and assessment plan – can help to identify which activities moved the work forward, and where barriers occurred.
Align Activities and Resources
If all current activities and metrics are mapped along a continuum, or a student pathway, maps can help to identify, align, and reconcile…
- Redundancy or competing ventures or activities.
- Potential known barriers so they can be mitigated early.
- Activities with similar measures or definitions for monitoring.
Support Target Setting
Knowing the depth and breadth of activities (viz a viz operational/process metrics), along with an understanding of how much these activities may influence student behavior, can help to estimate the magnitude of effect your activities have on long-term metrics.
Monitoring and Assessment Plan
Maps are a precursor to developing a monitoring and assessment plan. Embedded in a monitoring and assessment plan, a Strategies and Metrics Map promotes early and ongoing measurement of progress and success. Itallows identification of potential roadblocks at appropriate intervals so you can identify mitigations, and allows the institution to be nimble and change course quickly, if needed.
Mapping Methodology
Select Your Metrics
Consider two types of measurables:
Process or operational metrics measure how complete, robust or broad reaching an activity is, or whether the task is completed as scheduled. Process or operational metrics reflect such things as core competencies and skills, technologies, or culture, such as a new advising technology or DEI training for faculty. These metrics include near-term measures to determine the extent to which the activity is implemented or is meeting stated deadlines.
Examples:
- The number or percent of students served.
- The number or percent of faculty/staff trained on a new system.
- Whether the system is implemented by a stated deadline.
These types of metrics do not measure effectiveness, capacity or performance. They are diagnostic and can help identify a cause if something goes wrong – typically in implementation – and goals are not met.
Outcome metrics measure whether the project or activity is having the desired effect on student behavior. These measures include near- and long-term indicators.
Examples:
- The number of students declaring a major by end of first term.
- Second term persistence.
- The number of students enrolling in and completing gateway math in their first term.
Steps for Mapping
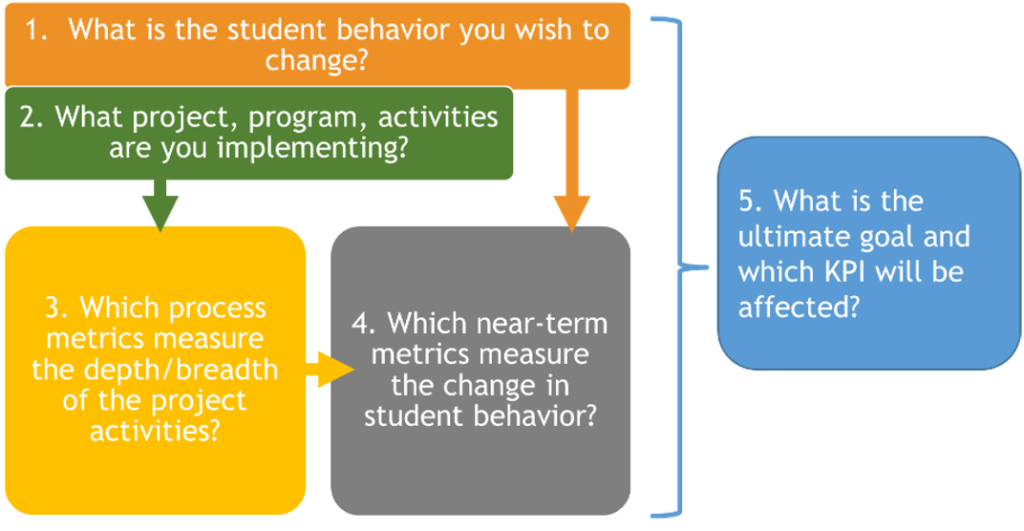
Step 1. Begin with the end and clearly defineyour focus. What is the behavior you want to change? This will help you determine what activities you need to implement, and pinpoint the related measures of progress.
Step 2. Identify the activity or project for which you are creating the map.
Step 3. Consider implementation—how will you know if the activity was implemented as expected, and how can you measure it?
Step 4. What will evidence that a change in behavior occurred, in the short term? What near-term metrics will allow you to assess the amount of change in behavior? Identify metrics to support near- and long-term assessment, for example, gateway course completion rate, percent of courses taken within program requirements, the number of students declaring majors.
Step 5. The goal of strategies and metrics mapping is to map your activities and initiatives to the long-term outcomes. Consider how your activities and initiatives can affect or change student behavior, both in the near- and the long-term.
Click here to download a template to help as you begin to develop your Strategies and Metrics Map
Case Study: Hypothetical U.
Hypothetical U. realized that large numbers of students were not enrolling in a coherent set of courses. Through further investigation, they identified specific challenges with advising that were causing barriers for their students – there was a lack of shared vision among advisors and misinformation being conveyed to students who, in turn, were frustrated. The university wanted to be in a place where their advising function was much more efficient and productive, and where students put trust in and made use of the advising system. The university identified the programs and supporting activities they needed to change, as well as new policies to implement. A summarized version of the university’s theory of change is below.
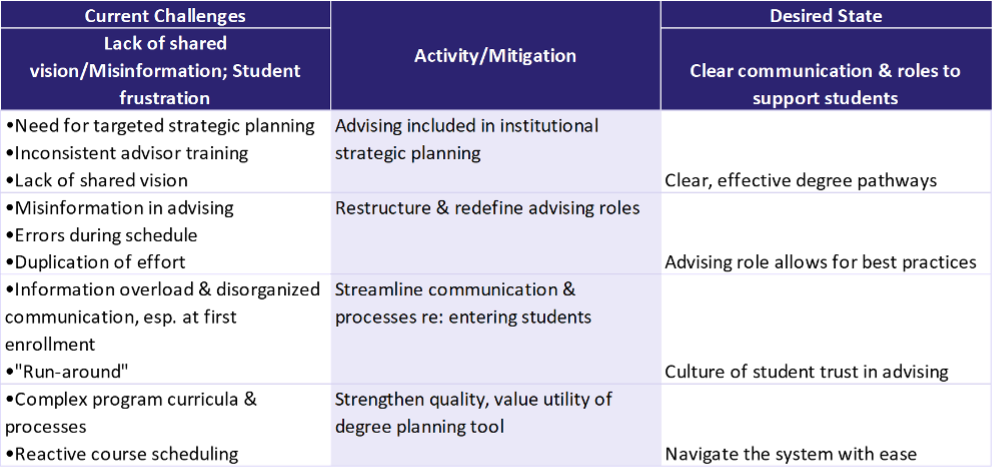
Hypothetical U. created a Strategy and Activities Map to organize their work, identify metrics for monitoring purposes, and understand the linkages involved so that they could better assess and manage expectations for improvement. See below.
| 1. | What is the behavior you wish to change? | Goal –> | Increase number of students declaring major early and enrolling in productive courses. |
| 2. | What is the project or activity? | Activities & projects –> | Revamp Advising |
| 3. | What are the early process metrics that can be used to determine the extent to which the activity is implemented? | Process indicators–> | 1. Number of students with at least one advisor appointment; number of students with multiple advisor appointments. 2. Student surveys & focus groups: student usage & experience, particularly where seeing gaps in outcomes. 3. Guidelines for advising developed and implemented. 4. One training developed; number of advisors and student support staff trained. 5. Number of major pathways redesigned with options reduced to targeted number. 6. Number of scheduling errors per student; number of errors overall. |
| 4. | What evidences a change in behavior? What are the near-term student outcomes you want to effect (e.g., within or at the 1st term)? | Near-term outcome indicators –> | 1. Percentage of students declaring a major, first term. 2. Number of students and percentage of courses taken that are in major/requirements, first term. 3. Percentage of credits attempted completed, first term. 4. Credit accumulation, first term. 5. GPA, first term. |
| 5. | Which KPI will the project affect? | Ultimate goal –> | INCREASE: Retention |